Connecting Kinde as an SP to Azure AD B2C via SAML
March 10, 2025
Transitioning from Non-managed to Managed WordPress on App Service Linux
March 11, 2025
Have you ever have the feeling that something that should be easy turns into a mine field when you start working on it? I seem to be a specialist in not reading the required documentation and making rookie mistakes. Fortunately, Application Gateway for Containers (AGC) offers enough troubleshooting tools so that I could identify and fix all my issues, so let’s have a look at them. This blog is part of a series:
- 1. Introduction to AGC architecture and components
- 2. Troubleshooting (this post)
In post #1 of the series I covered the fundamental components of AGC, but not necessarily how to deploy them. I am not going to copy/paste (too much) from the official docs containing the instructions to configure AGC, but instead look into some of the issues I found during my testing (most of them due to my inability to properly read docs), which made it clear for me how those components work between each other. If you are looking for info on how to troubleshoot AGC, to find some potential pitfalls or just to gain a better understanding of its architecture, this post is for you!
For the impatient, I have summarized here the 6 lessons that I learnt from this exercise:
- “Describe” the gateway resource in Kubernetes and look for error messages there.
- Look at the logs in ALB controller pods.
- Required Azure RBAC role assignments change depending on the deployment mode (managed or BYOD).
- Verify with the “kubectl describe gateway” command that your HTTP routes have been attached to the gateway.
- HTTP routes, healthcheck policies and the services they refer to must be in the same namespace.
- Check AGC Azure logs and metrics.
Are you curious? Let’s start!
Missing Resource Provider registrations
Yes, this is well documented, and yes, this is important. In one of my first tests I used a different subscription that did not have one of the required resource providers registered (see AGC’s prerequisites). As a consequence, my gateway resource in Kubernetes was not correctly provisioned by the controller using the managed deployment option:
❯ kubectl describe ApplicationLoadBalancer -n $alb_ns_name
Name:         appgw4c
Namespace:    alb-infra
Labels:
Annotations:
API Version:  alb.networking.azure.io/v1
Kind:         ApplicationLoadBalancer
Metadata:
  Creation Timestamp:  2025-02-23T17:05:25Z
  Generation:          1
  Resource Version:    12286
  UID:                 bc40951a-af09-4743-b356-8bc2ee5d79d3
Spec:
  Associations:
    /subscriptions/blahblah/resourceGroups/agc/providers/Microsoft.Network/virtualNetworks/aksVnet/subnets/subnet-alb
Status:
  Conditions:
    Last Transition Time:  2025-02-23T17:15:27Z
    Message:               Valid Application Gateway for Containers resource
    Observed Generation:   1
    Reason:                Accepted
    Status:                True
    Type:                  Accepted
    Last Transition Time:  2025-02-23T17:15:27Z
    Message:               error=Unable to create a managed Application Gateway for Containers resource with name alb-infra/appgw4c: failed to create Application Gateway for Containers alb-838c545c: POST https://management.azure.com/subscriptions/blahblah/providers/Microsoft.ServiceNetworking/register
--------------------------------------------------------------------------------
RESPONSE 403: 403 Forbidden
ERROR CODE: AuthorizationFailed
--------------------------------------------------------------------------------
{
  "error": {
    "code": "AuthorizationFailed",
    "message": "The client '03a36dac-bbcf-4bbd-a325-e1ab0418124f' with object id '03a36dac-bbcf-4bbd-a325-e1ab0418124f' does not have authorization to perform action 'Microsoft.ServiceNetworking/register/action' over scope '/subscriptions/blahblah' or the scope is invalid. If access was recently granted, please refresh your credentials."
  }
}
--------------------------------------------------------------------------------
    Observed Generation:  1
    Reason:               Ready
    Status:               False
    Type:                 Deployment
Events:
Clear error message, pointing to the problem: the controller was trying to register an RP that wasn’t registered, but did not have enough privilege. After installing the prereqs for AGC (RTFM), that error was gone.
Lesson learnt #1: “describe” the gateway resource and look for error messages there.
The CNI plugin is important
Kubernetes is a modular architecture that doesn’t include low-level details about how the network should be implemented. Instead, it defines the Container Network Interface (CNI), where network “plugins” offer different network implementations. AKS supports a couple of different options, but not all are compatible with AGC.
As we discussed in post #1 of this series, AGC is a reverse proxy sitting outside of your cluster:
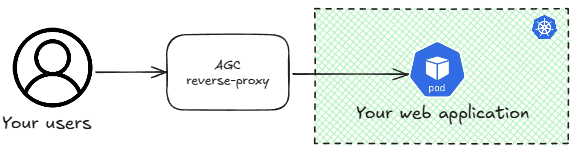
AGC will not send traffic to the IP address assigned to the Kubernetes service, but to the actual pods behind the service (that is why you don’t need a LoadBalancer-type service for AGC to work). This means that the pods’ IP addresses need to be routable in the VNet and reachable by the AGC. Consequently, CNI plugins such as kubenet or CNI overlay are not supported, since the pods use IP address ranges not routable in the VNet.
As per this issue AGC supports Azure CNI pod subnet with both dynamic and static IP allocation. However, when testing AGC managed deployment with an AKS cluster with Azure CNI pod subnet, my gateway would still not come up:
❯ kubectl describe ApplicationLoadBalancer -n $alb_ns_name
Name:         appgw4c
Namespace:    alb-infra
Labels:
Annotations:
API Version:  alb.networking.azure.io/v1
Kind:         ApplicationLoadBalancer
Metadata:
  Creation Timestamp:  2025-02-23T17:24:25Z
  Finalizers:
    alb-deployment-exists-finalizer.alb.networking.azure.io
  Generation:        1
  Resource Version:  16339
  UID:               c73e440b-d66b-4c8b-b0a1-a07b361dc838
Spec:
  Associations:
    /subscriptions/blahblah/resourceGroups/agc/providers/Microsoft.Network/virtualNetworks/aksVnet/subnets/subnet-alb
Status:
  Conditions:
    Last Transition Time:  2025-02-23T17:30:40Z
    Message:               Valid Application Gateway for Containers resource
    Observed Generation:   1
    Reason:                Accepted
    Status:                True
    Type:                  Accepted
    Last Transition Time:  2025-02-23T17:30:40Z
    Message:               alb-id=/subscriptions/blahblah/resourceGroups/agc-iaas-16849/providers/Microsoft.ServiceNetworking/trafficControllers/alb-838c545c error=failed to reconcile overlay resources: failed to get overlay extension config: no matches for kind "OverlayExtensionConfig" in version "acn.azure.com/v1alpha1"
    Observed Generation:   1
    Reason:                Ready
    Status:                False
    Type:                  Deployment
Events:
To research a bit further I inspected the logs of the ALB controller pods. There are two of them in the namespace where you deploy the helm chart, and they work as active/standby pair: one of them will be doing all the work, while the other is just waiting. If you inspect the logs of one of the pods you could end up looking at the standby pod, which will look like this:
❯ k logs -n $alb_controller_ns alb-controller-d5fbbc749-x2t62
Defaulted container "alb-controller" out of: alb-controller, init-alb-controller (init)
{"level":"info","version":"1.4.12","Timestamp":"2025-02-23T16:45:08.601323879Z","message":"Starting alb-controller"}
{"level":"info","version":"1.4.12","Timestamp":"2025-02-23T16:45:08.605575833Z","message":"Starting alb-controller version 1.4.12"}
{"level":"info","version":"1.4.12","Timestamp":"2025-02-23T16:45:09.23334933Z","message":"attempting to acquire leader lease azure-alb-system/alb-controller-leader-election..."}
If you see that, try the other one to see the actual logs of the AGC controller (I introduced some line breaks for readability):
$ k logs -n $alb_controller_ns alb-controller-d5fbbc749-w4rsj
[...]
{
	"level":"info",
	"version":"1.4.12",
	"AGC":"alb-infra/appgw4c",
	"alb-resource-id":"/subscriptions/blahblah/resourceGroups/agc-iaas-16849/providers/Microsoft.ServiceNetworking/trafficControllers/alb-838c545c",
	"operationID":"3eb64831-364d-4ae3-8a20-8f15366f261f","Timestamp":"2025-02-23T17:32:43.529199549Z",
	"message":"Application Gateway for Containers resource config update OPERATION_STATUS_SUCCESS with operation ID 3eb64831-364d-4ae3-8a20-8f15366f261f"
}
{
	"level":"info",
	"version":"1.4.12",
	"AGC":"alb-infra/appgw4c",
	"Timestamp":"2025-02-23T17:34:43.331448496Z",
	"message":"Association "/subscriptions/blahblah/resourceGroups/agc-iaas-16849/providers/Microsoft.ServiceNetworking/trafficControllers/alb-838c545c/associations/as-5bcf1489" already exists with subnet "/subscriptions/blahblah/resourceGroups/agc/providers/Microsoft.Network/virtualNetworks/aksVnet/subnets/subnet-alb""
}
{
	"level":"info",
	"version":"1.4.12",
	"AGC":"alb-infra/appgw4c",
	"Timestamp":"2025-02-23T17:34:43.331871102Z",
	"message":"Cluster is using overlay CNI, using subnetID "/subscriptions/blahblah/resourceGroups/agc/providers/Microsoft.Network/virtualNetworks/aksVnet/subnets/subnet-alb" for association"
}
So the ALB controller thinks that my AKS cluster is using CNI overlay, when it is actually using Azure CNI pod subnet! As far as I have tested (version 1.4.12 of the ALB controller) this is only a problem with the managed deployment option, and Bring-Your-Own deployment (creating the AGC, the frontend and the subnet association over the ARM API) works just fine.
Lesson learnt #2: look at the logs in the pods of the ALB controller.
Missing permissions
Of course, not only I forgot to register resource providers, but I assigned the required permissions in the wrong resource group. As you probably know, AKS has two resource groups: the “normal” resource group where you deploy the AKS resource, and the “node” or “infrastructure” resource group where AKS deploys auxiliary resources such as the Virtual Machine Scale Set, the Load Balancer, etc.
I had assigned permissions for the controller in the “node” resource group, since I started testing the managed deployment option, where the AGC is created in the “node” resource group. Then I switched to the Bring-Your-Own-Deployment style, and I created my AGC in the “normal” resource group, but I forgot to add a role assignment for this resource group. Consequently, I could see this error message in the ALB controller logs when the controller tried to configure the AGC:
$ k logs -n $alb_controller_ns alb-controller-d5fbbc749-w4rsj
{
	"level":"info",
	"version":"1.4.12",
	"AGC":"appgw4c",
	"operationID":"bd44fecd-3f18-4c97-bb46-917ccbf31275",
	"operationID":"bd44fecd-3f18-4c97-bb46-917ccbf31275",
	"Timestamp":"2025-02-23T19:07:53.400379035Z",
	"message":"Creating new Application Gateway for Containers resource Handler"
}
{
	"level":"info","
	version":"1.4.12","Timestamp":"2025-02-23T19:07:55.513578093Z",
	"message":"Retrying GetTrafficController after error: failed to get Application Gateway for Containers appgw4c: GET https://management.azure.com/subscriptions/blahblah/resourceGroups/agc/providers/Microsoft.ServiceNetworking/trafficControllers/appgw4cn--------------------------------------------------------------------------------nRESPONSE 403: 403 Forbidden
	ERROR CODE: AuthorizationFailed
	--------------------------------------------------------------------------------
	{
		"error": {
			"code": "AuthorizationFailed",
			"message": "The client '03a36dac-bbcf-4bbd-a325-e1ab0418124f' with object id '03a36dac-bbcf-4bbd-a325-e1ab0418124f' does not have authorization to perform action 'Microsoft.ServiceNetworking/trafficControllers/read' over scope '/subscriptions/blahblah/resourceGroups/agc/providers/Microsoft.ServiceNetworking/trafficControllers/appgw4c' or the scope is invalid. If access was recently granted, please refresh your credentials."
		}
	}
	--------------------------------------------------------------------------------
	Attempt: 1"
}
Thanks again to the AGC developers for meaningful messages! After adding the missing permissions I could move on.
Lesson learnt #3: Required Azure RBAC role assignments change depending on the deployment mode (managed or BYOD).
Not all HTTP routes are taken
Most examples in the public docs include gateway resources like this (this specific one is taken from here):
apiVersion: gateway.networking.k8s.io/v1
kind: Gateway
metadata:
  name: gateway-01
  namespace: test-infra
  annotations:
    alb.networking.azure.io/alb-namespace: alb-test-infra
    alb.networking.azure.io/alb-name: alb-test
spec:
  gatewayClassName: azure-alb-external
  listeners:
  - name: http-listener
    port: 80
    protocol: HTTP
    allowedRoutes:
      namespaces:
        from: Same
The text highlighted in the previous YAML definition actually instructs the ALB controller to only configure HTTP routes that happen to be in the same Kubernetes namespace as the gateway resource. Of course I had my HTTP route in a different namespace (thanks Murphy’s law), so that little piece of config prevented my routes from being programmed in AGC.
By the way, the effect of not having the route programmed is that you would see a 500 return code from AGC:
❯ curl -vvv "$fqdn/api/healthcheck"
* Host begab2ejctcsafes.fz03.alb.azure.com:80 was resolved.
* IPv6: (none)
* IPv4: 20.189.81.29
*   Trying 20.189.81.29:80...
* Connected to begab2ejctcsafes.fz03.alb.azure.com (20.189.81.29) port 80
> GET /api/healthcheck HTTP/1.1
> Host: begab2ejctcsafes.fz03.alb.azure.com
> User-Agent: curl/8.5.0
> Accept: */*
>
< HTTP/1.1 500 Internal Server Error
< date: Sun, 23 Feb 2025 19:54:54 GMT
< server: Microsoft-Azure-Application-LB/AGC
< content-length: 0
<
* Connection #0 to host begab2ejctcsafes.fz03.alb.azure.com left intact
One useful hint was again the “describe” command for the gateway:
❯ k describe gateway
[...]
Status:
[...]
  Listeners:
    Attached Routes:  0
[...]
Oh, no routes attached to the gateway? That is what put me on the right track.
Lesson learnt #4: verify with the “kubectl describe gateway” command that your HTTP routes have been attached to the gateway.
HTTP routes must be in the correct namespace
If you read the API gateway documentation you will probably know that the HTTP route needs to be in the same namespace as the service it refers to (for example in the Kubernetes article for Cross-namespace routing). Of course, I didn’t read that, so my first attempt had the HTTP route and the service in different namespaces. The error message returned by AGC in this case was a 404:
❯ curl -vvv "$fqdn/api/healthcheck"
* Host begab2ejctcsafes.fz03.alb.azure.com:80 was resolved.
* IPv6: (none)
* IPv4: 20.189.81.29
*   Trying 20.189.81.29:80...
* Connected to begab2ejctcsafes.fz03.alb.azure.com (20.189.81.29) port 80
> GET /api/healthcheck HTTP/1.1
> Host: begab2ejctcsafes.fz03.alb.azure.com
> User-Agent: curl/8.5.0
> Accept: */*
>
< HTTP/1.1 404 Not Found
< date: Sun, 23 Feb 2025 21:55:54 GMT
< server: Microsoft-Azure-Application-LB/AGC
< content-length: 0
<
* Connection #0 to host begab2ejctcsafes.fz03.alb.azure.com left intact
Again, the ALB controller logs came to the rescue:
$ k logs -n $alb_controller_ns alb-controller-d5fbbc749-w4rsj
[...]
{
	"level":"error",
	"version":"1.4.12",
	"AGC":"appgw4c",
	"error":"Service "yadaapi" not found",
	"Timestamp":"2025-02-23T21:44:11.659679636Z",
	"message":"Service 'default/yadaapi' not found on the cluster.ntPlease create the service on the cluster."
}
Why would the ALB controller expect to find my service (yadaapi) in the default namespace? Of course, because I had created the HTTP route in default! #FacePalm. Interestingly enough, it seems that the HTTProute syntax would allow to address a service in a different namespace:
apiVersion: gateway.networking.k8s.io/v1beta1
kind: HTTPRoute
metadata:
  name: yadaapi
  namespace: $app_ns
spec:
  parentRefs:
  - name: $agc_name
    namespace: default
    sectionName: http
  hostnames:
  - "$fqdn"
  rules:
  - backendRefs:
    - name: yadaapi
      namespace: $app_ns
      port: 8080
But that didn’t seem to work either. However, after moving the HTTP route to the same namespace as the service that error went away.
Lesson learnt #5: HTTP routes and the services they refer to must be in the same namespace.
Custom health checks
At this point I felt I was really close to the finish line! My HTTP route is now programmed in the gateway:
❯ k describe gateway
[...]
Status:
[...]
  Listeners:
    Attached Routes:  1
[...]
I couldn’t see any errors in the ALB controller logs, and yet when trying to access my application I was getting a nasty message back:
❯ curl "$fqdn/api/healthcheck"
no healthy upstream
I decided to have a look at the AGC logs. Yes, you can configure Diagnostic Settings as with any other Azure service, and if you do that using Azure CLI, bicep, Terraform or Powershell you might recognize another of the previous names that this service adopted during its inception. Check my script if you are curious now. Looking at the access logs, it is weird that no backend IP address is identified, which matches the error message “no healthy upstream” (you can see here the query I use to get the most important fields of the access logs):
❯ query="AGCAccessLogs | where TimeGenerated > ago(15m) | project TimeGenerated, ClientIp, HostName, RequestUri, FrontendName, FrontendPort, BackendHost, BackendIp, HttpStatusCode"
❯ az monitor log-analytics query -w $logws_customerid --analytics-query $query -o table
BackendHost    BackendIp    ClientIp             FrontendName    FrontendPort    HostName                             HttpStatusCode    TableName      TimeGenerated
-------------  -----------  -------------------  --------------  --------------  -----------------------------------  ----------------  -------------  ------------------------
-              -            193.68.89.10:33778   test-frontend   80              20.6.16.123                          404               PrimaryResult  2025-02-24T14:18:25.575Z
-              -            172.201.77.43:4392   test-frontend   80              begab2ejctcsafes.fz03.alb.azure.com  503               PrimaryResult  2025-02-24T14:17:50.096Z
-              -            172.201.77.43:13440  test-frontend   80              begab2ejctcsafes.fz03.alb.azure.com  503               PrimaryResult  2025-02-24T14:18:00.775Z
Of course, you can check the logs in the portal as well:

Coming back to the error message we got, “no healthy upstream” really sounds like a problem with the healthcheck probes? Azure metrics to the rescue! Inspecting the metrics for AGC confirmed my suspicion:

The healthcheck metrics made me look into the application pods to see what kind of traffic I was getting. I am using Ubuntu as base image, so I could install tcpdump and have a peek:
❯ k exec -it yadaapi-5f9f964f75-sg92z -- bash                                                                                                                                                                                               root@yadaapi-5f9f964f75-sg92z:/app#                                                                                                                                                                                                         root@yadaapi-5f9f964f75-sg92z:/app#                                                                                                                                                                                                         root@yadaapi-5f9f964f75-sg92z:/app# tcpdump -i any -n                                                                                                                                                                                       tcpdump: verbose output suppressed, use -v or -vv for full protocol decode                                                                                                                                                                  listening on any, link-type LINUX_SLL (Linux cooked), capture size 262144 bytes                                                                                                                                                             15:16:03.703771 IP 10.13.100.6.43667 > 10.13.76.31.8080: Flags [S], seq 1002697157, win 64240, options [mss 1410,sackOK,TS val 971262937 ecr 0,nop,wscale 10], length 0
15:16:03.703811 IP 10.13.76.31.8080 > 10.13.100.6.43667: Flags [S.], seq 3872851932, ack 1002697158, win 65160, options [mss 1460,sackOK,TS val 917096765 ecr 971262937,nop,wscale 7], length 0
15:16:03.704652 IP 10.13.100.6.43667 > 10.13.76.31.8080: Flags [.], ack 1, win 63, options [nop,nop,TS val 971262939 ecr 917096765], length 0
15:16:03.704730 IP 10.13.100.6.43667 > 10.13.76.31.8080: Flags [P.], seq 1:84, ack 1, win 63, options [nop,nop,TS val 971262939 ecr 917096765], length 83: HTTP: GET / HTTP/1.1
15:16:03.704747 IP 10.13.76.31.8080 > 10.13.100.6.43667: Flags [.], ack 84, win 509, options [nop,nop,TS val 917096766 ecr 971262939], length 0
15:16:03.707137 IP 10.13.76.31.8080 > 10.13.100.6.43667: Flags [P.], seq 1:25, ack 84, win 509, options [nop,nop,TS val 917096769 ecr 971262939], length 24: HTTP: HTTP/1.0 404 NOT FOUND
15:16:03.707544 IP 10.13.76.31.8080 > 10.13.100.6.43667: Flags [FP.], seq 25:394, ack 84, win 509, options [nop,nop,TS val 917096769 ecr 971262939], length 369: HTTP
15:16:03.707652 IP 10.13.100.6.43667 > 10.13.76.31.8080: Flags [.], ack 25, win 63, options [nop,nop,TS val 971262942 ecr 917096769], length 0
15:16:03.708080 IP 10.13.100.6.43667 > 10.13.76.31.8080: Flags [F.], seq 84, ack 395, win 63, options [nop,nop,TS val 971262942 ecr 917096769], length 0
15:16:03.708093 IP 10.13.76.31.8080 > 10.13.100.6.43667: Flags [.], ack 85, win 509, options [nop,nop,TS val 917096770 ecr 971262942], length 0
15:16:03.722656 IP 10.13.100.7.29605 > 10.13.76.31.8080: Flags [S], seq 2435215376, win 64240, options [mss 1410,sackOK,TS val 1831729387 ecr 0,nop,wscale 10], length 0
15:16:03.722681 IP 10.13.76.31.8080 > 10.13.100.7.29605: Flags [S.], seq 2775989149, ack 2435215377, win 65160, options [mss 1460,sackOK,TS val 1061642415 ecr 1831729387,nop,wscale 7], length 0
15:16:03.723200 IP 10.13.100.7.29605 > 10.13.76.31.8080: Flags [.], ack 1, win 63, options [nop,nop,TS val 1831729388 ecr 1061642415], length 0
15:16:03.723202 IP 10.13.100.7.29605 > 10.13.76.31.8080: Flags [P.], seq 1:84, ack 1, win 63, options [nop,nop,TS val 1831729388 ecr 1061642415], length 83: HTTP: GET / HTTP/1.1
15:16:03.723231 IP 10.13.76.31.8080 > 10.13.100.7.29605: Flags [.], ack 84, win 509, options [nop,nop,TS val 1061642416 ecr 1831729388], length 0
15:16:03.725555 IP 10.13.76.31.8080 > 10.13.100.7.29605: Flags [P.], seq 1:25, ack 84, win 509, options [nop,nop,TS val 1061642418 ecr 1831729388], length 24: HTTP: HTTP/1.0 404 NOT FOUND
15:16:03.725867 IP 10.13.100.7.29605 > 10.13.76.31.8080: Flags [.], ack 25, win 63, options [nop,nop,TS val 1831729391 ecr 1061642418], length 0
15:16:03.725894 IP 10.13.76.31.8080 > 10.13.100.7.29605: Flags [P.], seq 25:394, ack 84, win 509, options [nop,nop,TS val 1061642419 ecr 1831729391], length 369: HTTP
15:16:03.725935 IP 10.13.76.31.8080 > 10.13.100.7.29605: Flags [F.], seq 394, ack 84, win 509, options [nop,nop,TS val 1061642419 ecr 1831729391], length 0
15:16:03.726229 IP 10.13.100.7.29605 > 10.13.76.31.8080: Flags [.], ack 394, win 63, options [nop,nop,TS val 1831729391 ecr 1061642419], length 0
15:16:03.726305 IP 10.13.100.7.29605 > 10.13.76.31.8080: Flags [F.], seq 84, ack 395, win 63, options [nop,nop,TS val 1831729391 ecr 1061642419], length 0
15:16:03.726313 IP 10.13.76.31.8080 > 10.13.100.7.29605: Flags [.], ack 85, win 509, options [nop,nop,TS val 1061642419 ecr 1831729391], length 0
Oh, so each AGC instance (AGC is composed of multiple instances under the covers for resiliency and scalability) is sending GET requests trying to access the root URL (/), but my app is not configured to response to that! All clear, a quick Bing search showed me how to configure custom health probes for AGC. By the way, they need to be in the same namespace as the service they reference to as well, exactly like the HTTP routes, even if the resource model looks like referencing services cross-namespace should be possible.
Lesson learnt #6: check AGC Azure logs and metrics.
We made it!
Everything is working at this point! The HTTP response codes look good, so I could test the endpoints of my workload that provide some information about the packets:
❯ curl "http://${fqdn}/api/healthcheck"
{
  "health": "OK",
  "version": "1.0"
}
❯ curl "http://${fqdn}/api/ip"
{
  "host": "bzhpgzcvcmb2gtaa.fz15.alb.azure.com",
  "my_default_gateway": "169.254.1.1",
  "my_dns_servers": "['10.0.0.10']",
  "my_private_ip": "10.13.76.31",
  "my_public_ip": "135.237.230.47",
  "path_accessed": "bzhpgzcvcmb2gtaa.fz15.alb.azure.com/api/ip",
  "sql_server_fqdn": "None",
  "sql_server_ip": "False",
  "x-forwarded-for": "['93.104.182.164']",
  "your_address": "10.13.100.7",
  "your_browser": "None",
  "your_platform": "None"
}
❯ curl "http://${fqdn}/api/headers"
{
  "Accept": "*/*",
  "Host": "bzhpgzcvcmb2gtaa.fz15.alb.azure.com",
  "User-Agent": "curl/7.68.0",
  "X-Forwarded-For": "93.104.182.164",
  "X-Forwarded-Proto": "http",
  "X-Request-Id": "c1e7d023-0353-408f-a348-4bdc5623c4c2"
}
The metrics look good now, showing that both backends (the active and the standby one) are healthy:

Another interesting metric are the backend responses, broken down by backend service and return code. As expected, only the active farm is returning traffic, and you can see only 2xx (successful) return codes:

Additionally, the access logs in Azure Monitor show as well useful information about the individual requests that have happened:
❯ az monitor log-analytics query -w $logws_customerid --analytics-query $query -o table
BackendHost       BackendIp    ClientIp              FrontendName    FrontendPort    HostName                             HttpStatusCode    RequestUri        TableName      TimeGenerated
----------------  -----------  --------------------  --------------  --------------  -----------------------------------  ----------------  ----------------  -------------  ------------------------
10.13.76.31:8080  10.13.76.31  93.104.182.164:53198  fe-e3920793     80              bzhpgzcvcmb2gtaa.fz15.alb.azure.com  200               /api/healthcheck  PrimaryResult  2025-02-26T17:10:00.271Z
10.13.76.31:8080  10.13.76.31  93.104.182.164:53206  fe-e3920793     80              bzhpgzcvcmb2gtaa.fz15.alb.azure.com  200               /api/ip           PrimaryResult  2025-02-26T17:10:04.399Z
10.13.76.31:8080  10.13.76.31  93.104.182.164:53138  fe-e3920793     80              bzhpgzcvcmb2gtaa.fz15.alb.azure.com  200               /api/headers      PrimaryResult  2025-02-26T17:10:07.946Z
Bonus: gwctl
As additional tool to verify your Kubernetes configuration when using the gateway API there are certain tools that make your life easier. One of them is gwctl, an extension to kubectl that performs some additional checks on the configuration and lets you look deeper into the relationships between different resources.
In order to install it you need to build locally the gwctl repo, and then run the generated binary. It supports verbs such as get, describe, and analyze. This latter one is rather interesting, since it allows you to analyze YAML before deploying it.
For example, when describing the gateway with gwctl you would get the same info as with kubectl, but some additional useful info at the end letting you know which HTTP routes are attached to the gateway and what their backends are:
❯ gwctl describe gateway
Name: appgw4c
Namespace: default
Labels: null
[...]
AttachedRoutes:
  Kind       Name
  ----       ----
  HTTPRoute  yada/yadaapi
Backends:
  Kind     Name
  ----     ----
  Service  yada/yadaapi
DirectlyAttachedPolicies:
InheritedPolicies:
Events:
Conclusion
The architecture of Application Gateway for Containers can appear to be complex at first, due in part to the complexity of the Kubernetes Gateway API object model. However, AGC offers enough troubleshooting tools to help you debug your environment should you find any issue:
- Kubernetes
getanddescribecommands. - ALB controller logs.
- AGC logs and metrics.
- Documentation for AGC and the Gateway API.
- Traffic capture in the workload (as last resort, depending on the base image that your containers are using).
Have I missed any important troubleshooting tip or tool? Let me know in the comments below!