
What’s New in Microsoft Teams | February 2025
February 28, 2025
Global AI Bootcamp Milan: in presenza a Reggio Emilia e online
February 28, 2025
I haven’t had a look at the Azure Application Gateway for Containers for a while now, and after I was recently asked about it I decided to go for another dive. I believe I found a couple of interesting things that would be worthy to share, so here we go. This blog post is part of a series:
- 1. Introduction to AGC architecture and components (this post)
- 2. Troubleshooting
Let’s first run a quick intro of what this is all about. Azure Application Gateway for Containers or AGC is a reverse-proxy that you can place in front of your web workloads running on Kubernetes:
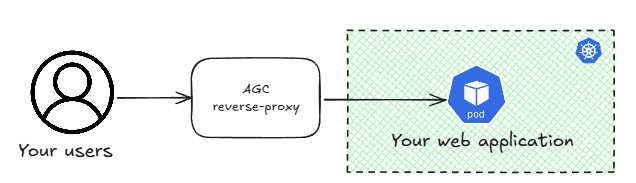
The reverse proxy terminates the HTTP(S) connection from the application users and then does something with them: it can manipulate HTTP headers, balance the load to different server farms depending on request attributes such as the URL, and much more. You can have this reverse-proxy embedded in your Kubernetes cluster, where the easiest option in Azure is using the nginx web application routing add-on for Azure Kubernetes Service (AKS), or you can have it outside of the cluster. This latter option has some benefits, such as for example that it doesn’t consume cluster resources such as CPU and memory, which are better used by your applications.
Microsoft used to have the Application Gateway Ingress Controller (AGIC) option to use with Kubernetes for an external Kubernetes reverse-proxy, but although this was adequate for some users, others had difficulties using this product. The most frequent problem I came across was the time it required to reconfigure itself. This caused downtime when performing operations such as application upgrades, which is the reason why workarounds such as this one exist.
AGC is fast!
OK, so let’s get this out of the way, even if I am getting ahead of myself. If AGIC hat a speed problem, does AGC fix it? Absolutely. Let me show you an example: I have configured AGC (we will get later at how to do that) with two serverfarms, an active one (with a weight of 999) and a standby (with a weight of 1, so it is actually serving 0.1% of the traffic):

By the way, this pattern is commonly known as “blue/green” load balancing, very frequently used to perform application migrations (and rollbacks) in a smooth way.
While I was running continuous requests every second I scaled down the active deployment to a single pod, so AGC converged to only sending client requests to the remaining one. Then I deleted the active deployment altogether, and AGC started sending requests to the standby server farm. Here you have a capture of my test, which is using the api/ip endpoint of my application to return the local IP address of the pod answering each request:
Tue Feb 25 08:54:12 CET 2025: 10.13.76.22
Tue Feb 25 08:54:13 CET 2025: 10.13.76.30
Tue Feb 25 08:54:14 CET 2025: 10.13.76.22
Tue Feb 25 08:54:16 CET 2025: 10.13.76.30
Tue Feb 25 08:54:17 CET 2025: 10.13.76.22
[Here we scale down the main deployment]
Tue Feb 25 08:54:18 CET 2025: 10.13.76.30
Tue Feb 25 08:54:20 CET 2025: 10.13.76.30
Tue Feb 25 08:54:21 CET 2025: 10.13.76.30
Tue Feb 25 08:54:22 CET 2025: 10.13.76.30
Tue Feb 25 08:54:24 CET 2025: 10.13.76.30
Tue Feb 25 08:54:25 CET 2025: 10.13.76.30
Tue Feb 25 08:54:26 CET 2025: 10.13.76.30
Tue Feb 25 08:54:27 CET 2025: 10.13.76.30
Tue Feb 25 08:54:29 CET 2025: 10.13.76.30
Tue Feb 25 08:54:30 CET 2025: 10.13.76.30
[Here we take down the active deployment, the standby farm takes over]
Tue Feb 25 08:54:31 CET 2025: 10.13.76.32
Tue Feb 25 08:54:32 CET 2025: 10.13.76.32
Tue Feb 25 08:54:34 CET 2025: 10.13.76.32
Tue Feb 25 08:54:35 CET 2025: 10.13.76.32
As you can see, load balancing works across both pods in the active deployment at the beginning, it then converges to 10.13.76.30 after that I remove the .22 pod, and when I delete the active deployment the standby pod 10.13.76.32 takes over the traffic. Not a single HTTP request was lost, so the convergence mechanism of AGC is at least subsecond. I could measure more granularly with more frequent requests, but the goal of this small test is showing that this is way better than the previous AGIC where delays of 30-60 seconds were not uncommon.
The object model
Before we start with a deep dive it’s important to clarify some nomenclature, so let’s have a closer look at what the overall object model looks like before going deeper. Don’t be scared about the following picture, I will break it down in smaller pieces:

The previous diagram is a bit of a simplification, since I am not including the optional ApplicationLoadBalancer resource created in the managed deployment mode or additional objects such as FrontendTLSPolicies, BackendTLSPolicies or RoutePolicies. Hold your breath for future posts!
The actual reverse proxy is a resource in Azure, so let’s start with that:

After creating the AGC resource itself you need to do two things: associating it to a dedicated subnet in your VNet, and creating a frontend IP address for it (only public frontends are supported at this time).
You have two options to do that: either using the ARM API, what the documentation refers to as “bring your own deployment”, or the Kubernetes API also known as the “managed” option”.
The BYOD option is easy: you just create the resources in Azure as you would create any other. For example, here the CLI for that (see the whole doc guide here, and my full deployment script here):
    az network alb create -g $rg -n $agc_name -o none --only-show-errors
    az network alb frontend create -g $rg --alb-name $agc_name -n $agc_frontend_name -o none --only-show-errors
    az network vnet subnet create -g $rg --vnet-name $vnet_name -n $agc_subnet_name --address-prefix $agc_subnet_prefix --delegations 'Microsoft.ServiceNetworking/trafficControllers' -o none --only-show-errors
    agc_subnet_id=$(az network vnet subnet show -g $rg --vnet-name $vnet_name -n $agc_subnet_name --query id --output tsv)
    echo "Associating the AGC with the subnet..."
    association_name='AppGW4Cassociation'
    az network alb association create -g $rg -n $association_name --alb-name $agc_name --subnet $agc_subnet_id -o none --only-show-errors
Oh, and by the way, AGC went over a couple of name changes during its development, some of which you can see in certain commands or APIs. When you see ALB or Application Load Balancer, it is the same as AGC or Application Gateway for Containers.
The alternative to using ARM is creating those objects with Kubernetes primitives. For that you need to have installed the “ALB Controller” in your Kubernetes cluster following this guide. Afterwards, you can just submit a YAML manifest such as this one, and the controller will create the AGC, the frontend and the association for you:
apiVersion: alb.networking.azure.io/v1
kind: ApplicationLoadBalancer
metadata:
  name: $agc_name
  namespace: $alb_ns_name
spec:
  associations:
  - $agc_subnet_id
Obviously, the controller will have to have enough privilege to create stuff in your Azure subscription, you should check the docs for the exact required permissions (or my full deployment script here).
Gateway API
Don’t worry, I am not going to bore you with yet another comparison between the Kubernetes ingress and gateway APIs, there are tons out there in the Internet. For the layman, suffice to say that there are two models to deploy reverse-proxies in Kubernetes: the good, old “ingress” way, and the new “gateway” way. The good news is that AGC supports both, so I am going to focus on the gateway API object model in this article.
After deploying the controller you will have two resources in your Kubernetes cluster: the pods running the controller logic, and a GatewayClass:

The gateway class is important, because when you create gateways you will refer to it. Our particular gateway class is always called azure-alb-external (making reference to the fact that only public IP addresses are supported today). This reference will instruct the controller to pick up any configurations such as HTTP routes or health check policies that are related to this gateway class and push them to the data plane. Let’s have a look at those:

The core of the logic is in HTTPRoutes. Here is where you define the logic that you want your load balancer to have. For example, I configured the test above with this HTTP route:
apiVersion: gateway.networking.k8s.io/v1
kind: HTTPRoute
metadata:
  name: yadaapi
  namespace: $app_ns
spec:
  parentRefs:
  - name: $agc_name
    namespace: default
  hostnames:
  - "$fqdn"
  rules:
  - backendRefs:
    - name: yadaapi
      port: 8080
      weight: 999
    - name: yadaapi-backup
      port: 8080
      weight: 1
In the YAML above you can see a couple of important things. First, the reference to the gateway (parentRef), which instructs the controller to deploy this HTTP route to AGC. And second, the server farms (backendRefs), which are Kubernetes services for your applications.
The parent of the HTTP routes is the Gateway resource, which you can consider as a representation or digital twin of the actual AGC existing in Azure (I am oversimplifying a bit, since in the managed deployment option the actual digital twin of the AGC in Kubernetes would be the ApplicationLoadBalancer resource).
AGC will send by default some predefined health checks to your pods to verify that they are up and running to prevent traffic black holing. In my case I had to overwrite those, because my test application (which you can get from https://github.com/Microsoft/YADA) doesn’t answer to the root URL but to /api/healthcheck. You can define health check policy resources where you configure the URL to ping, which HTTP hostname to use, the frequency of the health checks, and other details. Those health check policies will target specific services, and use your probe definitions to query the health of the pods linked to those services. You can find more details in the documentation for custom health checks. If you connect to one of your pods and have a look at the health check traffic for example with tcpdump, you should see that they are responding with HTTP 200 return codes:
root@yadaapi-5f9f964f75-sg92z:/app# tcpdump -i any -n
tcpdump: verbose output suppressed, use -v or -vv for full protocol decode
listening on any, link-type LINUX_SLL (Linux cooked), capture size 262144 bytes
14:08:44.951129 IP 10.13.100.7.44203 > 10.13.76.31.8080: Flags [S], seq 3891512090, win 64240, options [mss 1410,sackOK,TS val 1741290623 ecr 0,nop,wscale 10], length 0
14:08:44.951170 IP 10.13.76.31.8080 > 10.13.100.7.44203: Flags [S.], seq 3972086831, ack 3891512091, win 65160, options [mss 1460,sackOK,TS val 971203644 ecr 1741290623,nop,wscale 7], length 0
14:08:44.951825 IP 10.13.100.7.44203 > 10.13.76.31.8080: Flags [.], ack 1, win 63, options [nop,nop,TS val 1741290624 ecr 971203644], length 0
14:08:44.951828 IP 10.13.100.7.44203 > 10.13.76.31.8080: Flags [P.], seq 1:101, ack 1, win 63, options [nop,nop,TS val 1741290624 ecr 971203644], length 100: HTTP: GET /api/healthcheck HTTP/1.1
14:08:44.951880 IP 10.13.76.31.8080 > 10.13.100.7.44203: Flags [.], ack 101, win 509, options [nop,nop,TS val 971203645 ecr 1741290624], length 0
14:08:44.954811 IP 10.13.76.31.8080 > 10.13.100.7.44203: Flags [P.], seq 1:18, ack 101, win 509, options [nop,nop,TS val 971203647 ecr 1741290624], length 17: HTTP: HTTP/1.0 200 OK
14:08:44.955119 IP 10.13.76.31.8080 > 10.13.100.7.44203: Flags [FP.], seq 18:188, ack 101, win 509, options [nop,nop,TS val 971203648 ecr 1741290624], length 170: HTTP
14:08:44.955222 IP 10.13.100.7.44203 > 10.13.76.31.8080: Flags [.], ack 18, win 63, options [nop,nop,TS val 1741290627 ecr 971203647], length 0
14:08:44.955447 IP 10.13.100.7.44203 > 10.13.76.31.8080: Flags [F.], seq 101, ack 189, win 63, options [nop,nop,TS val 1741290627 ecr 971203648], length 0
14:08:44.955464 IP 10.13.76.31.8080 > 10.13.100.7.44203: Flags [.], ack 102, win 509, options [nop,nop,TS val 971203648 ecr 1741290627], length 0
14:08:47.384004 IP 10.13.100.6.17055 > 10.13.76.31.8080: Flags [S], seq 3566511683, win 64240, options [mss 1410,sackOK,TS val 880826625 ecr 0,nop,wscale 10], length 0
14:08:47.384044 IP 10.13.76.31.8080 > 10.13.100.6.17055: Flags [S.], seq 3633356606, ack 3566511684, win 65160, options [mss 1460,sackOK,TS val 826660446 ecr 880826625,nop,wscale 7], length 0
14:08:47.384875 IP 10.13.100.6.17055 > 10.13.76.31.8080: Flags [.], ack 1, win 63, options [nop,nop,TS val 880826626 ecr 826660446], length 0
14:08:47.384878 IP 10.13.100.6.17055 > 10.13.76.31.8080: Flags [P.], seq 1:101, ack 1, win 63, options [nop,nop,TS val 880826626 ecr 826660446], length 100: HTTP: GET /api/healthcheck HTTP/1.1
14:08:47.384949 IP 10.13.76.31.8080 > 10.13.100.6.17055: Flags [.], ack 101, win 509, options [nop,nop,TS val 826660447 ecr 880826626], length 0
14:08:47.389026 IP 10.13.76.31.8080 > 10.13.100.6.17055: Flags [P.], seq 1:18, ack 101, win 509, options [nop,nop,TS val 826660451 ecr 880826626], length 17: HTTP: HTTP/1.0 200 OK
14:08:47.389600 IP 10.13.76.31.8080 > 10.13.100.6.17055: Flags [FP.], seq 18:188, ack 101, win 509, options [nop,nop,TS val 826660451 ecr 880826626], length 170: HTTP
14:08:47.389739 IP 10.13.100.6.17055 > 10.13.76.31.8080: Flags [.], ack 18, win 63, options [nop,nop,TS val 880826631 ecr 826660451], length 0
14:08:47.390076 IP 10.13.100.6.17055 > 10.13.76.31.8080: Flags [F.], seq 101, ack 189, win 63, options [nop,nop,TS val 880826632 ecr 826660451], length 0
14:08:47.390206 IP 10.13.76.31.8080 > 10.13.100.6.17055: Flags [.], ack 102, win 509, options [nop,nop,TS val 826660452 ecr 880826632], length 0
^C
20 packets captured
20 packets received by filter
0 packets dropped by kernel
Another critical fact that you can learn out of the previous capture is that the AGC’s data plane is redundant: you can see that the health checks are coming from two IP addresses out of my AGC subnet (that happens to be 10.13.76.0/27): 10.13.76.6 and 10.13.76.7. This is so because AGC under the covers has at least two instances to forward traffic, and each of them probes the pods’ health independently.
So finally we can go back to the full picture, where hopefully now the individual pieces and how they relate to each other make sense:

Conclusion
I hope I could give you some perspective on what Application Gateway for Containers is, its internal architecture and some of its advantages as compared to older Azure products. In future posts I will cover further details about how to configure specific functionality and how to troubleshoot it.
If you have any suggestion for AGC topics that you would like me to cover, please let me know in the comments!