
Why Upgrading to the Latest Azure Maps APIs Matters
March 21, 2025
Microsoft 365 subscribers can now experience Copilot in OneDrive
March 21, 2025
I would like to credit for this blog post to Abhishek Sharma, talking to him gave me the main inspiration for some of the concepts you are going to see below. Heartfelt thanks go as well to Niti Gupta, a kickass Microsoft engineer who can make Azure Monitor Workbooks really dance and who gave me inspiration for some security-based queries.
If you have been reading my blog, you are probably familiar with Flow Logs. Back in the day I blogged about how to use NSG Flow Logs to detect traffic anomalies, about different ways to access NSG Flow Logs, and more recently about the main functional differences between VNet FLow Logs and ExpressRoute Traffic Collector as well as some sample queries to query VNet Flow Logs,
In case you don’t know what I am talking about, let me give you a short primer. Azure lets you log the traffic going through your VNets: its first version was called “NSG Flow Logs”, and the current one is called “VNet Flow Logs”. Those logs are similar to NetFlow/sFlow, if you are familiar with traditional network traffic logging protocols.
You can optionally enable Traffic Analytics on top of your flow logs. This will enrich them with additional information such as IP reputation and geolocation, so that you can get more insights about your traffic. On top of that, Traffic Analytics moves the logs from Azure Storage to a Log Analytics workspace, which makes them easily queriable.
This post is going to be a long one, but hopefully it will help you not only to deploy managed Grafana, but also to use some of its features along with VNet Flow Logs and KQL. Are you ready? Let’s get started!
Kickass dashboards
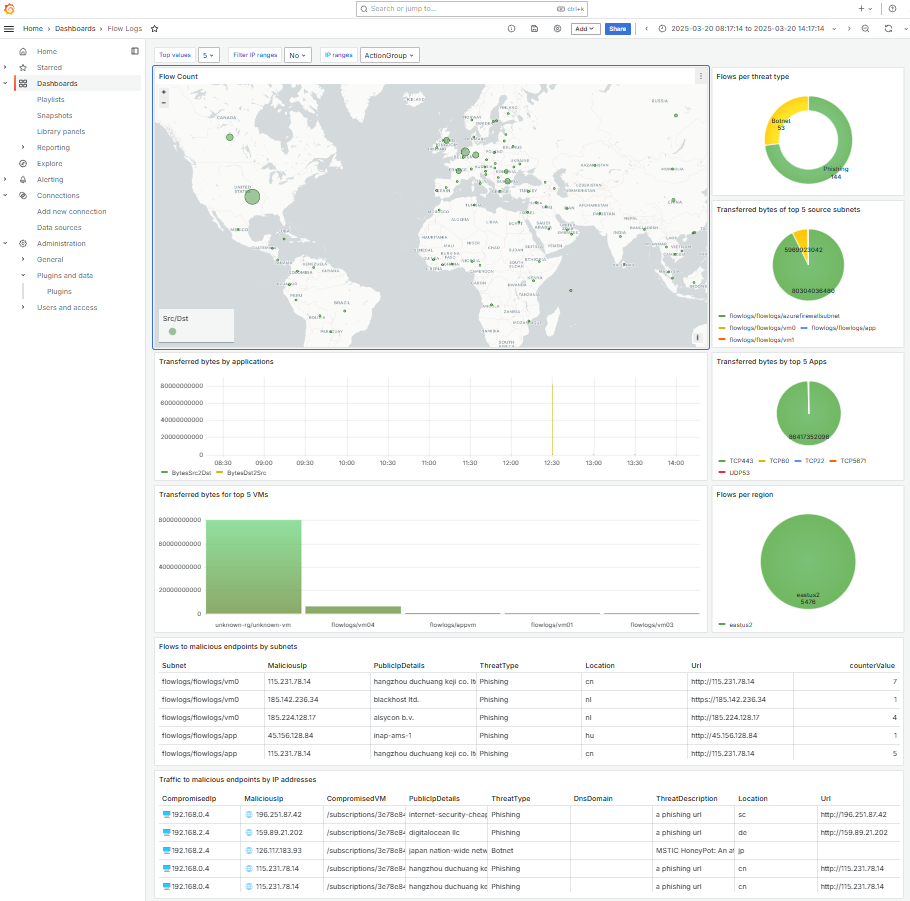
Organizations can enjoy the out-of-the-box dashboards offered by Traffic Analytics, build their own dashboards on Azure Monitor using Workbooks, which are really powerful and are integrated in Azure. And yet these are not the only ways in which you can build your dashboards: any analysis tool that can integrate with Azure Monitor can be used for this. This post is going to be about using Grafana for that goal to create dashboards like this (get the JSON for this dashboard from my GitHub repo):
Grafana is an observability and visualization platform that is used by many organizations around the globe. There are many ways to deploy Grafana, the easiest in Azure is probably using Azure Managed Grafana. You just need to create a managed Grafana resource, get its URL, and start rolling!
az grafana create -n $grafana_name -g $rg -l $location -o none
grafana_url=$(az grafana show -n $grafana_name -g $rg -o tsv --query properties.endpoint)
echo "Grafana URL is $grafana_url"
You should be able to authenticate with your Azure username into the Grafana portal, if for some reason the creation script failed to grant you access you can do it yourself:
my_user_id=$(az ad signed-in-user show --query id -o tsv)
grafana_id=$(az grafana show -n $grafana_name -g $rg --query id -o tsv)
az role assignment create --assignee $my_user_id --role 'Grafana Admin' --scope $grafana_id -o none
Finally, you need to allow Grafana to fetch the logs from the Log Analytics workspace where Traffic Analytics stores the enriched VNet Flow Logs:
logws_id=$(az resource show -n $logws_name -g $rg --query id -o tsv)
grafana_principal_id=$(az grafana show -n $grafana_name -g $rg --query identity.principalId -o tsv)
az role assignment create --assignee $grafana_principal_id --role 'Log Analytics Reader' --scope $logws_id -o none
And you should be ready to rumble now! From here on, everything will happen in the Grafana portal.
Grafana + Azure: plug and play
Grafana has native integration with Azure Monitor: when adding new data connections you will see that option out of the box:

After adding the new connection and data source, you need to configure which authentication to use. In this example I am using Grafana’s managed identity for simplicity (that is the identity I granted access to the Log Analytics workspace):

And that is basically it, when you click on “Save & test” or you start adding elements to your dashboards, you can use native KQL to query the logs. You need to do three things:
- Change the “Service” from “Metrics” to “Logs”.
- Select your Log Analytics workspace as the resource to query.
- Write your KQL query.
For example, here the panel that gives me a distribution of malicious traffic per threat type:

Using the Grafana time filter variable
Alright, the last query was easy, but Grafana lets you modify the time settings for your data series:

How do you use this filter in your queries? Easy, you only need to refer to use the where statement | where $__timeFilter(). For example, we can extend the previous query for the flow count per threat type:
NTAIpDetails
| where $__timeFilter(TimeGenerated)
| where FlowType contains "Malicious"
| summarize count() by ThreatType
Simple variables: parametrizing the “top” count
Let’s continue with variables: how could you parametrize how many “top” results do you want to get? Like only the top 1, or the top 5, or the top 10? You can do that easily with Grafana variables. The first thing is defining a static variable (we will have a look later at query-based variables):

That lets our variable show in the dashboard like this:

And how do you use the variable in your Kusto queries? You can use the syntax $variable_name or ${variable_name}. For example, this is the last line of my “Transferred bytes by top apps”:
| top $TopNumber by TotalBytes
By the way, you can use variables as well in the panel titles with the same syntax:

So when the user sets the “top” value to 5, this is what it would look like:

Query variables: Filtering by service tag
Alright, let’s try higher heights: what about filtering traffic taking the IP address ranges allocated to each Service Tag? The first thing is getting Grafana to understand JSON. There are many plugins out there, and Infinity is a very popular one. Unfortunately it is not available in the list of plugins in managed Grafana yet. However, another promising plugin appears there:

Alright, now I just need to configure a data source using the JSON API connection and download the service tag IP ranges. Unfortunately it is not that easy, because of the way they are stored. Unfortunately there is no JSON API, but instead the service tag IP ranges can be downloaded from here, which is a redirection link for the actual URL where the most current file will be located.
In order to work around this, I created a short script (courtesy of StackOverflow) that gets the latest copy of the IP ranges and uploads them to a storage account (you can see my full deployment script here):
root_url='https://www.microsoft.com/en-us/download/details.aspx?id=56519'
file_url=$(curl -Lfs "${url}" | grep -Eoi ']+>' | grep -Eo 'href="[^"]+"' | grep "download.microsoft.com/download/" | grep -m 1 -Eo '(http|https)://[^"]+')  # sample output: https://download.microsoft.com/download/7/1/d/71d86715-5596-4529-9b13-da13a5de5b63/ServiceTags_Public_20250303.json
blob_name=ipranges.json
wget -q -O "/tmp/${blob_name}" $file_url
az storage blob upload -c $storage_container_name -f "/tmp/${blob_name}" -n $blob_name --account-name $storage_account_name --auth-mode key --account-key $storage_account_key --overwrite -o none
Now I can create a data source to teach Grafana how to get the IP ranges (I configured anonymous access for the blob, since the data is not confidential):

Alright, getting closer now! We need to define a variable containing the IP ranges. We need to get the right information from the JSON, and split it in “text” (what we want users to select) and “value” (the actual value of the IP ranges that we will use in our queries). Here is how I defined the variable:

You can see that it refers to the data source defined previously, and extracts two keys from each record: name and properties.addressPrefixes. Additionally, it renames those properties to text and value respectively. Notice as well how the value field is hard coded to be a string, this will be important later.
You need now to tell Grafana which of these is the text, and which one the value (you would think that it should be able to guess, right?). You can do that in the “Experimental” tab:

Oh, and I will create another yes/no static variable so that the user specifies whether they want to filter per service tag or not. This looks like this in the dashboard:

Almost there! We only need to access the variable from the KQL in the panels. Since the value of the variable is a string, the KQL function parse_json will be quite handy to convert it to a list. After that, we can just use the list as argument of the ipv4_is_in_any_range function. This is what one of the queries looks like with the service tag filtering:
// Variables
let IPrangesStr = '${IPranges}';
let IPrangesDyn = parse_json(IPrangesStr);
// Query
NTANetAnalytics
| where $__timeFilter(TimeGenerated)
| where isnotempty(DestPublicIps) or isnotempty(SrcPublicIps)
| project SrcIp, SrcPublicIps, DestIp, DestPublicIps
// Standard format for DestPublicIp
| extend DestPublicIpsList = split(DestPublicIps, ' ')
| mv-expand DestPublicIpsList
| extend DestPublicIp = tostring(split(DestPublicIpsList, '|')[0])
// Standard format for SrcPublicIp
| extend SrcPublicIpsList = split(SrcPublicIps, ' ')
| mv-expand SrcPublicIpsList
| extend SrcPublicIp = tostring(split(SrcPublicIpsList, '|')[0])
// Filter by service tag if required
| extend FilterIPRangesBool = "$FilterIPRanges"
| where (FilterIPRangesBool == "No") or ipv4_is_in_any_range(SrcPublicIp, IPrangesDyn) or ipv4_is_in_any_range(DestPublicIp, IPrangesDyn)
[...]
The Geomap panel
And as a final touch, we do want a map, don’t we? Grafana has an embedded visualization called geomap. But let’s start first with the query: I will count the flows where either the source or the destination is a public IP address per country:
// Variables
let IPrangesStr = '${IPranges}';
let IPrangesDyn = parse_json(IPrangesStr);
// Query
NTANetAnalytics
| where $__timeFilter(TimeGenerated)
| where isnotempty(DestPublicIps) or isnotempty(SrcPublicIps)
| project SrcIp, SrcPublicIps, DestIp, DestPublicIps
// Standard format for DestPublicIp
| extend DestPublicIpsList = split(DestPublicIps, ' ')
| mv-expand DestPublicIpsList
| extend DestPublicIp = tostring(split(DestPublicIpsList, '|')[0])
// Standard format for SrcPublicIp
| extend SrcPublicIpsList = split(SrcPublicIps, ' ')
| mv-expand SrcPublicIpsList
| extend SrcPublicIp = tostring(split(SrcPublicIpsList, '|')[0])
// Filter by service tag if required
| extend FilterIPRangesBool = "$FilterIPRanges"
| where (FilterIPRangesBool == "No") or ipv4_is_in_any_range(SrcPublicIp, IPrangesDyn) or ipv4_is_in_any_range(DestPublicIp, IPrangesDyn)
// Enrich with location for src and dst
| lookup kind=leftouter NTAIpDetails on $left.DestPublicIp==$right.Ip
| lookup kind=leftouter NTAIpDetails on $left.SrcPublicIp==$right.Ip
| extend Direction = iff(isempty(SrcIp), 'Inbound', 'Outbound')
// Consolidate Location
| extend country_code = iff(isnotempty(Location), Location, Location1) | project-away Location1
// Summarize by country
| where isnotempty(country_code)
| summarize FlowCount=count() by country_code
The important bits of the KQL above are the lookups with the NTAIpDetails table that will give us the country codes in the Location field, and the summarization. Note that we rename the Location field to country_code, because we need to configure the geomap visualization to look at that field for the geo-location and to FlowCount for the data:

And sure enough, here is our geomap panel!

Conclusion
I loved writing this post because getting started with Grafana was so easy, Grafana docs were really helpful to get going and do some nice things, but there was as well some good challenge with the query variables that drink from JSON API! What do your Grafana dashboards for VNet Flow Logs look like? Let me know in the comments!
